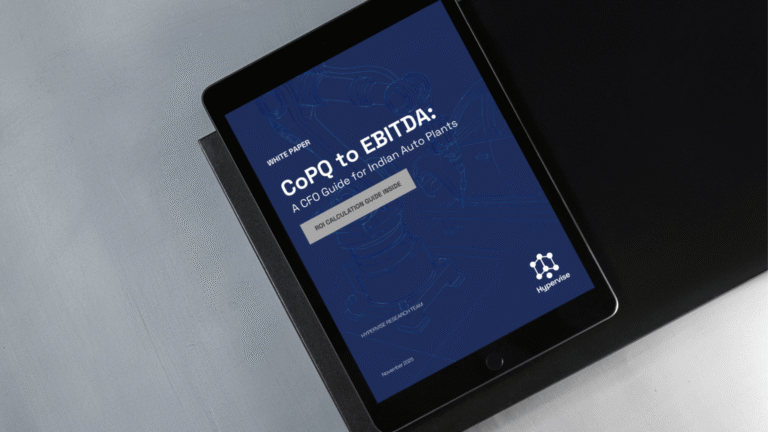
Why Download This Now?
As a CFO or COO, you are under pressure to:
- Protect EBITDA in a margin-squeezed market
- Fund automation and transformation without stretching capex
- Prove payback on every major operational initiative
Quality is one of the few levers that can still move margins meaningfully—without a pricing war or costly customer acquisition. Every rupee removed from CoPQ flows almost directly into EBITDA.
This guide gives you a clear, finance-first framework to quantify that opportunity and make it board-ready.
What You Get Inside
1. A simple financial model—from FPY to EBITDA: See how First Pass Yield (FPY) on each line translates into CoPQ and, ultimately, EBITDA impact. Use a clear, repeatable logic you can plug directly into plant reviews and board decks.
Access the White Paper — Unlock the CoPQ to EBITDA Link
2. A practical way to quantify CoPQ: Break down CoPQ into scrap, rework, yield loss, downtime, warranty and recalls. Learn how to express it as a % of sales and benchmark it against world-class standards—without needing a consulting project.
3. A line-by-line view of where money is really leaking: Understand the major CoPQ hotspots in press shops, BIW, paint, and final assembly. See concrete examples of “minor” defects that collectively drive heavy margin erosion.
4. A ready-to-use ROI and payback framework: Use the companion ROI calculator to model scenarios using your own numbers:
- Current CoPQ and EBITDA impact
- Savings at different FPY and CoPQ improvement levels
- Payback periods for investments in analytics, automation or process change
5. A 90-day pilot blueprint: Get a practical roadmap for proving value on one line before committing plant-wide spend: governance, data requirements, roles, milestones, risk controls.
Who This Is For
This guide is designed for:
- CFOs and Finance Leaders in OEMs and Tier-1/2 suppliers who need a clear link between quality initiatives and EBITDA.
- COOs, Plant Heads and Operations Leaders responsible for throughput, uptime and cost.
- Heads of Quality / Continuous Improvement who must build a strong financial justification for their next initiative.
If you oversee P&L for an automotive plant in India and suspect quality is costing more than it should, this guide is for you.
About Hypervise
This guide is produced by the Hypervise Research & Insights team, combining automotive manufacturing experience, quality engineering, and AI-driven analytics. Our mission is to turn factory data into actionable quality intelligence that reduces CoPQ and improves EBITDA.
Make Your Next Quality Discussion a Margin Discussion
In just 20 minutes, you’ll walk away with:
- A quantified view of your CoPQ opportunity
- A CFO-ready narrative linking CoPQ to EBITDA
- An ROI calculator to support your next plant or board review