Key Takeaways
- Automated Bottleneck Detection: Vision AI identifies accumulation points instantly, enabling immediate correction of flow issues.
- Precision Takt Time: Replace manual stopwatches with frame-by-frame analysis to align production precisely with demand.
- Actionable Data: Shift from historical reporting to real-time alerts that prevent downtime before it impacts the bottom line.
In the high-stakes environment of modern manufacturing, speed is not just a metric—it is the fundamental currency that determines profitability and market competitiveness. Plant managers are constantly seeking ways to shave seconds off processes, knowing that even small, aggregated time savings translate directly into higher throughput and reduced operational costs.
Cycle Time Analysis has evolved from manual stopwatch observations into sophisticated, AI-driven insights that provide granular visibility into every second of production efficiency.
What Is Cycle Time Analysis?
Cycle Time Analysis is the systematic evaluation of the total time required to complete a specific task or process step—from start to finish—within a manufacturing workflow. It is a critical metric in Lean Manufacturing, used to identify inefficiencies, establish benchmarks, and ensure production rates align with takt time to meet customer demand without generating excess inventory.
Method 1: Spotting Bottlenecks (Where Do Parts Pile Up?)
One of the most persistent challenges in assembly line management is identifying where—and why—production flow is impeded. Many delays are caused by micro-stoppages that are difficult to detect through manual observation alone.
Vision AI systems continuously monitor buffer zones and conveyor belts using live video feeds, automatically flagging instances where parts begin to accumulate beyond defined thresholds. By visualizing congestion points in real time, managers can quickly identify the exact station causing the delay and reallocate resources before the issue cascades downstream.
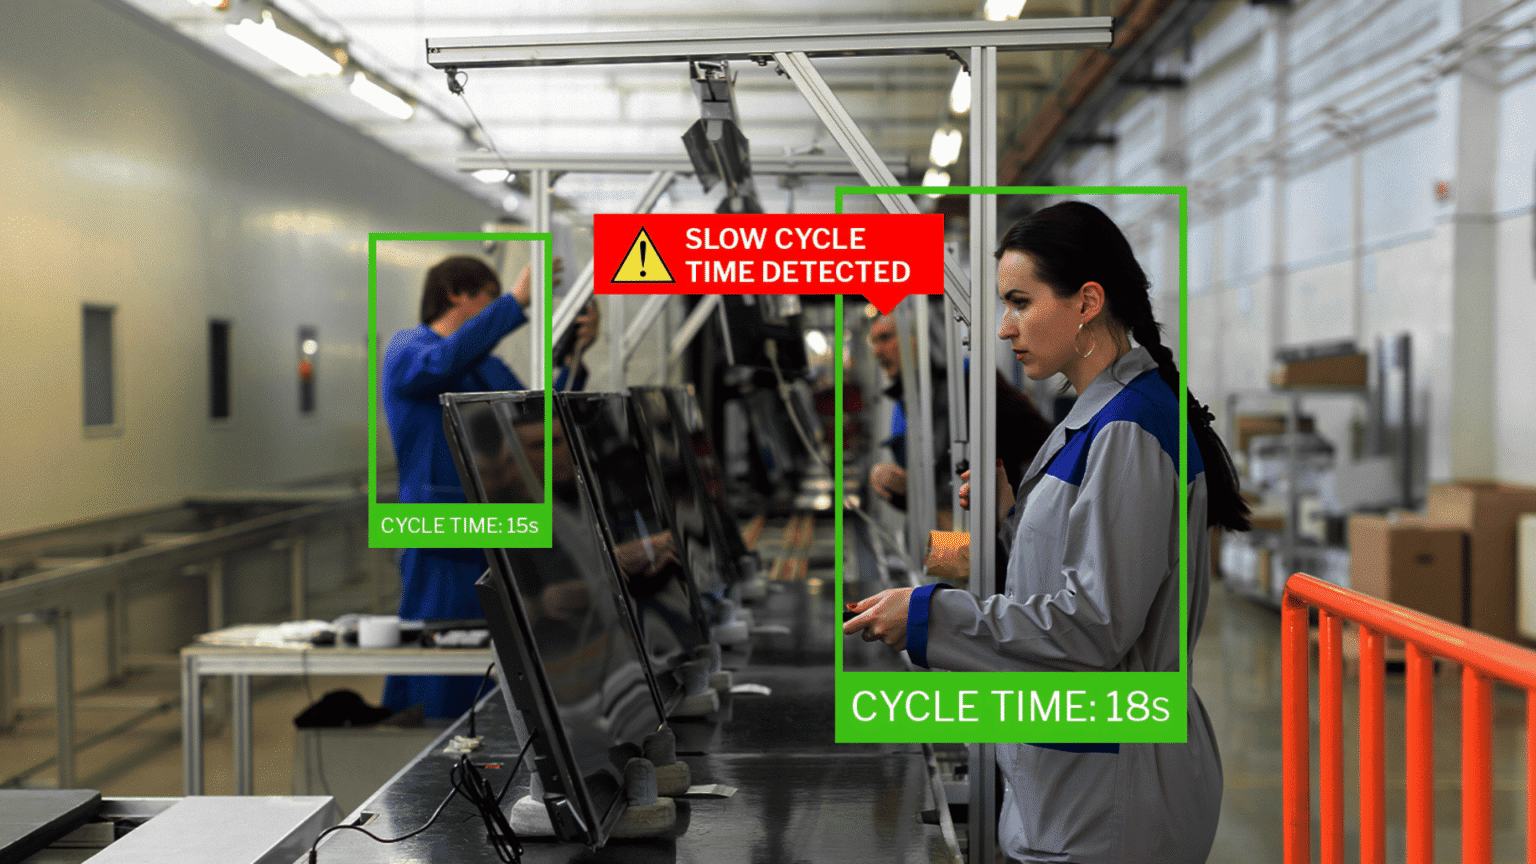
Method 2: Measuring Takt Time Automatically
Traditional takt time calculations rely on intermittent sampling and manual timing, which introduces errors and fails to capture shift-to-shift variability. Computer vision algorithms eliminate this limitation by tracking unit entry and exit at each workstation with millisecond-level precision.
This continuous Cycle Time Analysis reflects the true operational rhythm of the factory floor. Deviations from takt time are highlighted instantly, allowing production speeds to be adjusted dynamically to stay aligned with demand.
Method 3: Reducing Manual Checks
Manual quality inspections often slow production, as operators must stop the line to physically handle, inspect, and log data for each unit or batch. Vision AI transforms this process by enabling non-invasive, high-speed inspection.
Cameras detect defects—such as misalignments, surface scratches, or missing components—without stopping the conveyor. For plant managers seeking to eliminate inspection-related delays, automated QA can reclaim significant production time while maintaining consistent quality standards.
Method 4: Predicting Machine Downtime
Unexpected equipment failure is one of the biggest threats to consistent cycle time, often resulting in prolonged and costly production stoppages. Vision AI supports predictive maintenance by monitoring subtle visual indicators of machine health, including abnormal vibrations, reduced actuation speed, or irregular component movement.
By correlating these visual signals with historical failure data, the system can predict impending breakdowns and trigger maintenance actions during planned downtime—keeping production running smoothly during peak hours.
Method 5: Streamlining Operator Movement (Action Recognition)
Inefficient operator movement—commonly referred to in Lean Manufacturing as “waste of motion”—can significantly inflate cycle times, yet it is difficult to quantify without intrusive monitoring.
Advanced action recognition technology maps skeletal movements to generate digital “spaghetti diagrams,” revealing unnecessary walking, excessive reaching, or ergonomic inefficiencies. These insights allow managers to redesign workstation layouts for optimal ergonomics, ensuring every movement adds value and reducing time spent on manual assembly tasks.
Comparison: Manual vs. Vision AI Cycle Time Analysis
The following table illustrates the operational differences between traditional manual analysis and modern Vision AI implementations.
| Feature | Manual Analysis | Vision AI Analysis |
| Data Collection | Intermittent, human-dependent (stopwatch-based) | Continuous, automated (24/7 monitoring) |
| Accuracy | Prone to human error and bias | Millisecond precision with objective data |
| Bottleneck Detection | Reactive (identified after backlog forms) | Proactive (real-time accumulation alerts) |
| Scalability | Limited by personnel availability | Scales effortlessly across multiple lines |
| Cost Impact | High labor cost for data collection | Initial investment with low ongoing cost |
Frequently Asked Questions
Cycle time refers to the time required to complete one unit at a specific process or workstation. Lead time, by contrast, includes the total duration from order placement to final delivery, encompassing processing, queuing, and logistics. Cycle Time Analysis focuses on internal efficiency, while lead time reflects the entire customer-facing timeline.
Vision AI provides continuous visibility into flow interruptions across all stations simultaneously. By quantifying queue lengths, idle times, and throughput variations, it identifies the root cause of bottlenecks—whether related to machine performance or operator workflow—enabling targeted corrective actions.
In many cases, Vision AI software can integrate with existing IP camera systems, provided the resolution and frame rate meet analytical requirements. This significantly lowers adoption costs by eliminating the need for a complete hardware upgrade.